
REST and GraphQL
Any method, custom headers, a body and authentication - and rules over the JSON that comes back.
API monitoring
HostTracker's API monitoring tool checks your endpoints' uptime, response time and payload from 300+ locations, against rules you write in plain terms - a status code, a JSON field, a response time - and alerts you the moment a call stops matching them.
How one API check runs
Rules read the response and compare. Together these four cover the layers that matter.
api.example.com/v1/orders · 4 rules · pass
status isOk
header("Content-Type") contains "json"
body.json.path("$.count") gt 0
time lt 5s
Structured queries into JSON, XML, HTML or YAML; the redirect chain hop by hop; the negotiated TLS protocol and cipher.
Compare this run with the previous one: a counter that never goes backwards, a body hash that must not change.
JSONPath, XPath or a regular expression picks a value; equal, range, list membership or null decides.
Learn moreThe request shaped the way the endpoint expects, the rules over what comes back.
Any method, custom headers, a body and authentication - and rules over the JSON that comes back.
Parse the body as XML and select with XPath. The envelope is just another response.
Post a payload on a schedule and assert on the acknowledgement, so a silent receiver is caught before a partner notices.
HostTracker checks your API endpoints on schedule, validating the status code, the content type, and the values inside the response - not just whether the server answers.
Monitoring your APIs is really important. It helps you keep an eye on how well they're performing, how available they are, and whether they're doing what they're supposed to. It also makes sure they're meeting performance standards, which helps you avoid any potential issues
Uptime monitoring is basically just checking an API endpoint at regular intervals to make sure it's there when you need it and works well. Performance monitoring is about measuring how quickly and reliably an API responds to requests.
How well APIs work can have a big impact on how users experience the apps, how well they work overall, and even the bottom line for the business.
The value a rule extracts is stored per check and drawn beside response time and speed.
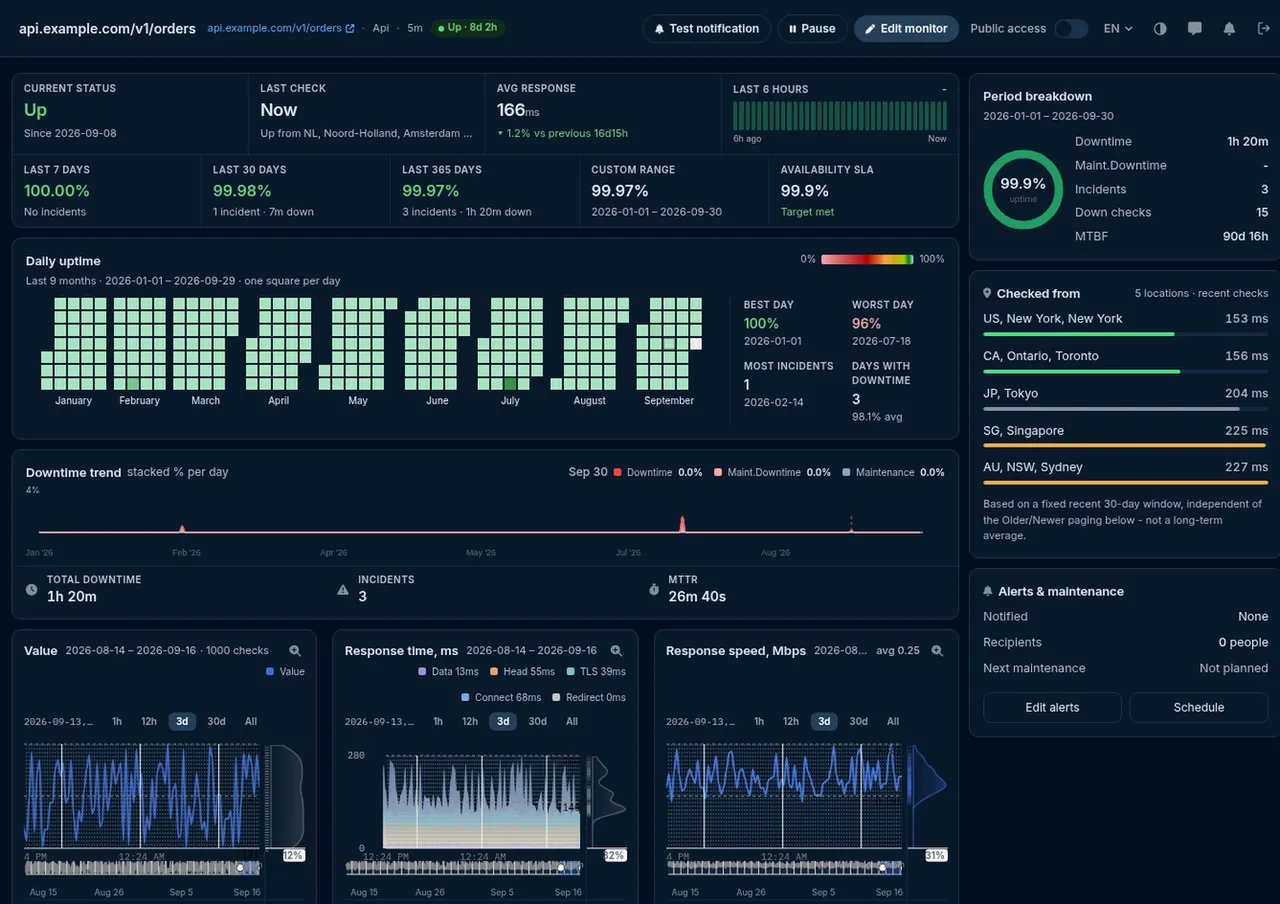
body.json.path("$.count") becomes a series. A drop to zero is visible before it is an alert.
Connect, TLS, header and data time per check, from every location you chose.
Websites, servers, APIs, certificates. One check type per page, the same locations, alerts and reports behind all of them.
"I've worked with this monitoring service for a long time, and my daily routine is no longer a problem. It quietly watches all my sites and lets me respond the moment something goes wrong."
Trusted by teams at





Every chapter opens in place, so the page stays short.
REST API monitoring looks superficially like uptime monitoring and is a different job. An API is consumed by code, not by people, and code is unforgiving in ways a browser is not. A human visitor tolerates a page that renders slightly wrong; an integration that receives a field of the wrong type simply breaks. So API monitoring has to check more layers than "did the server answer", and HostTracker checks them in order, failing at the first one that does not hold.
| Layer | What is verified | The failure it catches |
|---|---|---|
| 1 · Reachability | DNS resolves, the TCP connection opens, the TLS handshake completes | The endpoint is gone, the certificate expired, the host is unroutable from part of the world |
| 2 · Status | The HTTP status code, against the codes you accept or explicitly treat as errors | A 500 after a deploy, a 401 from an expired credential, a 429 you were not expecting |
| 3 · Timing | Total response time, and its breakdown across connect, TLS, headers and body | An endpoint that still works but has quietly gone from 200 ms to four seconds |
| 4 · Shape | Content type and headers - is this actually JSON, or an HTML error page wearing a 200 | An error page or a login redirect served where a payload should be. The classic silent API failure |
| 5 · Content | A value selected out of the payload, or free-form assertions over the whole response | A field missing after a schema change, an empty result set, a version string that rolled back, an error member appearing inside a successful response |
Layers one to three are what an ordinary uptime check gives you. Four and five are what make it API monitoring - and they are the layers where most real API incidents actually live.
Before anything can be validated, the monitor has to make the request your API expects. The full request surface is available on an API monitor:
| Setting | What you can do with it |
|---|---|
| HTTP method | GET, HEAD, POST, PUT, PATCH or DELETE |
| Custom headers | Any name and value pairs you need - a bearer token, an API key, a tenant identifier, an Accept version header. Headers are forwarded only to the same host across a redirect, so a credential never leaks to a third party your endpoint bounces to. |
| Request body | A raw body for POST, PUT and PATCH, or form-encoded parameters |
| HTTP authentication | A username and password, with the scheme the server asks for negotiated on the connection |
| Redirects | Follow them or not, cap how many are followed, or treat any redirect at all as a failure - useful for an endpoint that must answer directly |
| Timeout | Up to 100 seconds, defaulting to 40 - and a timeout is a check failure, which is exactly what you want from an endpoint with an SLA |
| Response size cap | Defaults to 1 MB and can be raised, so a runaway response cannot consume the check |
| Accepted and rejected status codes | Lists of codes to ignore, and codes to treat as errors - the tool for an endpoint that legitimately answers 401 or 404 as part of its contract |
| DNS control | Resolve through specific resolvers, bypass the checkpoint's DNS cache, and assert on which IP addresses the host resolves to |
| TLS strictness | Opt in to requiring a valid certificate chain, TLS 1.2 or better, ciphers above 128-bit, and a revocation check - plus certificate-expiry watching on the same connection |
The most expressive way to validate a response is to write rules for it. Each rule is one line, rules are combined with AND, and a monitor can carry up to twenty of them. This is the verified starting bundle for a JSON API:
status isOk
header("Content-Type") contains "json"
body.json.path("$.count") gt 0
time lt 5s
Four lines, and between them they cover the four layers that matter: the endpoint answered with a 2xx, it
answered with JSON rather than an error page, the payload contains a real result rather than an empty
one, and it did all that inside the budget. Individually useful rules from the same catalogue include
body.json.path("$.status") eq "ok" for an API's own health verdict,
body.json.path("$.error") absent for an error member appearing in an otherwise-successful
response, body.json.path("$.version") eq "2.4.1" to catch an unintended rollback,
redirects.count eq 0 for an endpoint that should answer directly, and
cert.days.left gt 14 for the certificate on the same connection.
Rules read subjects out of the response and compare them. The subjects cover the status code; the total
response time and its connect, TLS, DNS, header and body components; the raw body along with its size and
a hash of it; structured queries into the payload as JSON, XML, HTML or YAML; individual response headers;
the final and original URL and their parts; the redirect chain, hop by hop; the certificate's remaining
days, issuer and names; the negotiated TLS protocol and cipher; the addresses DNS returned; and
Set-Cookie. Comparisons run from the obvious - equal, less than, greater than - through
contains, startsWith, endsWith, matches for a regular
expression, containsAny and containsAll for a set, in for a list of
acceptable values, and exists, isNumber and unique.
There is also a change-detection axis: a rule can compare this run's value against the previous run's, so you can assert that a counter never goes backwards or that a body hash has not changed - the shape of rule that catches a silent rollback or an unauthorised content change rather than an outage.
Alongside the rule language there is a simpler, single-value path that has been part of API monitoring here for a long time and is often all a check needs. You tell the monitor how to parse the body, how to select one value out of it, and what that value must be:
The predicate applied to the selected value covers equal and not-equal, less-than and greater-than in both strict and inclusive forms, membership in a list of acceptable values or exclusion from one, inside a numeric range or outside it, and a test for the value being null or absent altogether.
A malformed selector is rejected when you save, not at three in the morning. The selector is compiled at validation time, so a typo in a JSONPath or an XPath is an error on the form rather than a monitor that has been silently failing - or silently passing - ever since you created it.
Every failure in this table returns HTTP 200. That is the entire problem with monitoring an API on its status code alone: the transport succeeded, so the transport reports success.
| What went wrong | What the response looks like | What catches it |
|---|---|---|
| An error page is served where a payload should be | 200, with HTML | A content-type assertion, or a rule that the body parses as JSON |
| The search index stopped rebuilding | 200, with an empty results array | A rule that the result count is at least one |
| A field was renamed in a schema change | 200, valid JSON, missing member | A rule that the field exists |
| A deploy was rolled back without anyone noticing | 200, older version string | A rule pinning the version field |
| An error member appears inside a success envelope | 200, with an error member set | A rule that the error member is absent |
| A downstream dependency is failing and the API is degrading gracefully | 200, with partial or stale data | A rule on the API's own health field, or a freshness value in the payload |
| The endpoint now answers in four seconds instead of two hundred milliseconds | 200, eventually | A response-time rule |
| Authentication silently stopped being applied | 200, returning data it should not | A dedicated negative monitor - an unauthenticated request that must return 401 |
That last row is worth doing deliberately. A second monitor that sends no credentials and asserts on a 401 is the cheapest way to find out that an authorisation layer has been accidentally disabled - a failure no amount of positive testing will ever surface.
API monitors run from HostTracker's public checkpoint fleet - 300+ checkpoints across 158 cities - and you choose which locations a given monitor uses. Geography matters more for an API than for a website: an endpoint fronted by a CDN or a geo-routed load balancer can be healthy in Frankfurt and failing in São Paulo, and a single-location check has no way to see it. The same goes for DNS - a stale or misconfigured record often propagates unevenly, which looks like an intermittent outage from the inside and a regional one from the outside.
Running from many places raises an obvious risk: more checkpoints, more chances for one flaky network path to cry wolf. HostTracker handles that with a confirmation quorum. When a checkpoint reports a failure, the check is repeated across additional independent checkpoints and the state change is only confirmed once they agree - by default a majority verdict across up to seven agents, with a minimum of three. You can make that stricter, requiring a set number of agents to report the failure or full agreement among them, for an endpoint where a false page is worse than a slow one.
After confirmation, alerting follows the delay each contact chose - immediately, or after 3, 5, 15, 30 or 60 minutes, or 3, 6, 12 or 24 hours of continuous failure - across the nine notification channels: email, SMS, voice call, webhook, Slack, web push, and the messenger apps Telegram, Discord and Viber. The webhook channel is how alerts reach an incident manager or a team chat tool.
The check is a configurable HTTP request plus response analysis, so what it fits follows directly from that.
data - and it is worth asserting that the errors member is absent, since
GraphQL famously answers 200 with errors inside.What does not fit is a sequence - obtain a token, use it, then delete the resource. An API monitor makes one request per run. For a genuine multi-step journey, the browser-driven transaction check is the tool; for the timing of a page rather than an endpoint, see browser access and page-load timing.
These are complementary and frequently confused. An observability or APM platform instruments your code and tells you what happened inside a request. External API monitoring stands outside your infrastructure and tells you what a consumer actually receives. Both are worth having; neither substitutes for the other.
| External API monitoring | APM / observability | |
|---|---|---|
| Vantage point | Outside your infrastructure, over the public internet | Inside your application process |
| Requires code changes | No - nothing is installed anywhere | An agent or SDK in every service |
| Sees DNS, routing, TLS and CDN problems | Yes - they are on the path it takes | No - they happen before the request arrives |
| Still reports when the whole platform is down | Yes - it is not hosted by you | Often not - the thing that reports is also down |
| Explains why a request was slow inside your code | No - it sees the timing breakdown, not your stack | Yes - that is its whole purpose |
| Covers an endpoint nobody has called today | Yes - it calls it on a schedule | No - no traffic, no telemetry |
The pattern most teams land on is external monitoring for detection and internal telemetry for diagnosis: HostTracker tells you an endpoint broke, from where, and against which rule, and your own tracing tells you why. Alongside it, a database query monitor often explains an API that got slow, and server load monitoring explains the host it runs on.
An API monitoring tool sends requests to your API endpoints on a schedule and evaluates the response against rules you define, rather than just confirming the server responded at all. HostTracker's API monitoring first verifies that the endpoint is reachable and returns the expected HTTP status code, then checks that the content type of the response matches what's expected (JSON, XML, plain text, and so on), and finally searches within the response body for specific values or patterns you've configured. This layered approach catches problems that a simple "is it up" check would miss entirely - an endpoint can return a normal 200 status code while still returning corrupted, incomplete, or outdated data because of a backend bug, a failed database query, or a broken integration further down the chain. Setting clear validation policies up front means the monitor knows what a healthy response actually looks like for your specific API.
Website uptime monitoring typically checks whether a page loads and returns a normal HTTP status code, which works well for pages meant to be viewed in a browser. API monitoring goes further because APIs are consumed by code, not people, so a "working" response has to satisfy stricter requirements: the right content type, valid structure, and correct values inside the payload, not just a successful status code. An endpoint can return HTTP 200 while the actual data is wrong, missing, or malformed, and traditional uptime checks alone won't catch that since they only look at the response code. HostTracker's API monitoring checks both layers - reachability and status code, like uptime monitoring does, plus content-type validation and searching the response body for expected values - giving a much more accurate picture of whether an API is genuinely functioning correctly.
Yes, that's the core of what distinguishes API monitoring from a basic uptime check. HostTracker lets you set validation policies that go beyond confirming the endpoint responded: you can specify the expected content type so a check fails if an endpoint unexpectedly starts returning HTML instead of JSON (a common symptom of an error page being served instead of real data), and you can search within the response content for specific values that must be present for the response to count as healthy. This means a check can fail even when the HTTP status code looks perfectly normal, catching cases where a backend bug or a broken downstream integration produces a technically successful but functionally wrong response. Validating actual content, not just connectivity, is what makes API monitoring meaningful for endpoints other systems depend on.
After confirming an endpoint responds and its content type matches your expectation, HostTracker's API monitoring searches within the returned content for the specific values or text patterns you've configured as part of the check's validation policy. This lets you confirm that a response contains a particular field, status value, or piece of data that indicates the endpoint is functioning correctly - for example, verifying that a health-check endpoint's response includes an expected status value rather than an error message wrapped in a 200 response. If the expected content isn't found, the check is marked as failed even though the connection itself succeeded, and you're alerted through your configured notification channels. This kind of content-aware checking is particularly useful for catching partial failures, where an API is technically reachable but quietly returning incomplete or incorrect data.
Check frequency is configurable, and HostTracker's paid plans support intervals as fast as once a minute across its monitoring types, so API endpoints that are critical to your application's uptime can be checked nearly continuously. The permanent free plan runs checks every 30 minutes on up to two monitors, which is a reasonable frequency for lower-priority or internal APIs where a short delay in detecting a problem isn't costly. For business-critical APIs - ones that power a live application, a payment flow, or an integration your customers depend on - shorter intervals mean problems get caught and addressed before they cascade into a larger outage that users actually notice. A 30-day full-feature trial with 1-minute checks and no credit card required lets you test how fast detection needs to be for your specific API.
Yes. An API monitor can send whatever the endpoint requires to accept the request: arbitrary custom headers - which is how a bearer token, an API key header or a tenant identifier is supplied - plus a username and password for HTTP authentication, a request body for POST, PUT or PATCH, and any HTTP method from GET and HEAD through POST, PUT, PATCH and DELETE. The practical advice is the same as for any automated client: issue the monitor its own credential rather than reusing a person's, give it the narrowest scope that still exercises the endpoint meaningfully, and prefer a read-only endpoint or a dedicated health route over anything that mutates data. If your tokens are short-lived, point the monitor at an endpoint whose auth does not expire - a health or status route protected by a long-lived key - rather than trying to make the monitor perform a token exchange it has no way to do.
API checks run on an interval from one minute up to 24 hours - 1, 2, 3, 5, 10, 15, 30 and 45 minutes, then 1, 2, 4, 6, 12 and 24 hours - and a new monitor defaults to three minutes. They run from HostTracker's public checkpoint fleet, which spans 300+ checkpoints across 158 cities, and you choose which locations a given monitor uses. Running from several regions matters more for an API than for a website: an endpoint fronted by a CDN or a geo-routed load balancer can be perfectly healthy in one region and failing in another, and a single-location check simply cannot see that. It also drives the false-alarm control - when one checkpoint reports a failure, the check is repeated from other independent checkpoints and the state change is only confirmed once the quorum agrees, so one flaky network path between a data centre and your host does not page anyone.
Both. For a one-off test, the free HTTP check runs your endpoint from 300+ locations right now, with no account. An API monitor is the same request repeated on a schedule, as often as every minute, with your validation rules applied to every response and an alert the moment one fails. Most teams start with the checker to see what a location reports, then add the monitor for the endpoints their customers or integrations depend on.
When an API monitoring check fails - whether because the endpoint didn't respond, returned an unexpected content type, or didn't contain the values your validation policy requires - HostTracker sends an alert through whichever of its 9 notification channels you've configured, including email, SMS, voice call, webhooks, Slack, and messenger apps like Telegram, Discord and Viber. This lets your team find out about a broken or degraded API the moment it's detected, rather than through a support ticket after the integration has already been failing silently for hours. Because the check evaluates both reachability and content, the alert reflects a real functional problem with the API rather than just a connectivity blip, which helps avoid both missed incidents and unnecessary noise.
Start a free trial and get alerted the moment an endpoint returns the wrong status, breaks its contract, or slows down.
Part of HostTracker's website monitoring software.