Server load monitoring

Server Monitoring: CPU, RAM & Disk Load Checks

HostTracker's server monitoring tracks CPU, RAM, and HDD load in real time. It monitors CPU load, memory usage, and HDD load, helping optimize server performance and user experience.

30-day free trial · all features · no credit card required
server-01 · load check
Healthy · all within limits
CPU34%
RAM61%
Disk (/var)48%
MySQL connect12 ms
Read from the collector on your server · just now
Server Monitoring

Spot resource problems before they cause downtime

CPU

CPU Load Tracking

HostTracker monitors CPU usage to keep servers efficient and stable. It tracks your server's CPU usage, identifying problems and alerting you to unusual spikes. Monitoring CPU load helps administrators keep their servers running smoothly and prevent downtime.

Memory

Memory Usage Trends

HostTracker monitors memory usage to help maintain server performance. This feature tracks memory usage and identifies trends that could cause slowdowns or crashes. Reports and alerts help administrators improve memory use. Good RAM monitoring means apps run well and there are no surprises due to memory issues.

Disk

Disk Space Alerts

HDD monitoring by HostTracker prevents storage issues affecting server performance. This service tracks disk space usage and alerts administrators to prevent issues such as insufficient storage or disk failures. Monitoring and reporting help you keep on top of disk space issues, so your server always has enough space to work smoothly. This helps keep servers reliable and prevents data loss due to storage issues.

Turn a one-time check into 24/7 server monitoring
Add your server once and HostTracker tracks CPU, RAM, and disk load around the clock, alerting you before a resource problem causes downtime.
Start free trial

How the numbers reach HostTracker - with no agent on your server

Most server monitoring products ask you to install an agent: a background process with system-level access that runs permanently on your machine and streams data out. HostTracker deliberately does not. It is an external monitoring service, and a server load check works the other way round - your server exposes one small read-only endpoint that reports a single number, and HostTracker requests it on the schedule you set.

That inversion is the whole design. There is no daemon to keep alive, no privileged software you did not write running on production, no credentials handed to a third party, and no inbound management port. What you expose is a URL that accepts no commands, changes nothing and returns one value.

Option 1

The PHP collector

A ready-made script for a Linux or Unix host already running PHP. Drop it into a web-served directory and point the monitor at that base URL. It reads the machine's own CPU, memory and disk figures locally and answers with the number.

Option 2

The ASP.NET collector

The Windows equivalent, for a host running IIS. Same idea, plus access to any Windows performance counter by category, name and instance - so anything Performance Monitor can show you locally can be monitored remotely.

Option 3

Your own endpoint

Point the monitor at any URL you like and answer with a tiny JSON object. Ten lines in any language, nothing on your server that you did not write, and you decide exactly which numbers are exposed. This is the option most engineering teams end up preferring.

Nothing is ever pushed to your machine. The collector is deployed by you, when you choose, and HostTracker only ever makes a request to it. If you remove it, monitoring stops - it has no other way in.

What a server monitor can measure

Each monitor watches one value, so a typical server ends up with three or four of them - and each gets its own threshold, its own history and its own alert. The value types are:

MetricReported asWhat it is good for
CPUUtilisation percentSustained saturation, runaway processes, undersized instances, the load a deploy added
RAMUtilisation percentMemory leaks, creeping consumption between restarts, the pressure that precedes an out-of-memory kill
DiskUtilisation percent for a path or drive you nameLogs, uploads and backups filling a volume - the slowest and most predictable outage there is
TCP portConnect time in millisecondsWhether a service on the machine is still accepting connections, and how quickly
SQL ServerConnect time in millisecondsDatabase reachability and authentication from the server's own point of view
MySQLConnect time in millisecondsThe same, for MySQL
Windows performance counterWhatever the counter reportsAnything Performance Monitor exposes, by category, counter name and instance - queue lengths, handles, per-process figures

If what you need is the database behind the server rather than its connect time, that is a different and deeper check: a database query monitor connects, authenticates, runs a query you write and compares the value it returns against a threshold.

Writing your own collector

The contract is deliberately trivial, because the point is that you can read it in one sitting and implement it in whatever language your team already runs. HostTracker requests your URL; your endpoint answers with a JSON object carrying the value:

{ "v": 42.7 }

That is the whole required surface. Two optional members make the result more useful: e carries an error string when the value could not be read this time - a much better outcome than reporting a misleading zero - and vs carries a version string of your own, which shows up in the result so you can tell which build of the collector answered.

{ "v": 91.4, "e": "", "vs": "collector-2.1" }

Because you write the reader, you are not limited to what a generic agent knows how to collect. Queue depth, cache hit ratio, the number of jobs waiting, the age of the oldest unprocessed record, free inodes, the size of a directory that must never grow - anything you can express as a number becomes a monitored value with thresholds, history and alerting attached to it.

Protect the endpoint. It has to be reachable by the checkers that call it, so treat it like any other public URL: put it on an unguessable path, keep it read-only, and expose only the numbers you are comfortable being read. It accepts no parameters that change anything, which keeps the exposure to exactly one value.

Setting a threshold that means something

A raw number is data; a threshold is what turns it into monitoring. Each monitor carries a condition and one or two limits, so you can express the shape of "wrong" rather than just a ceiling:

  • greater than or less than a limit - the everyday form. CPU above 90. Free disk below 10.
  • equals or does not equal a limit - for a value that is really a state: a worker count that must stay at 4, a flag that must stay at 0.
  • inside a range or outside a range, with two limits - the right shape for anything with a healthy band rather than a healthy maximum. A queue that is normally between 10 and 500 is telling you something when it reads 0, and something else when it reads 5,000.
  • no condition at all - collect and chart the value without ever failing the check. Useful for a metric you want history on before you know what "bad" looks like.

The debounce is the setting that stops the noise

Alongside the threshold sits a count of consecutive overloaded checks before the monitor goes down, adjustable from zero up to twenty. It is the single most valuable knob on the page and the one most often left alone. A server at 95% CPU for one sample during a nightly backup is not an incident. A server at 95% for five checks in a row is. Set the count to match how long your workload is legitimately allowed to be busy, and a whole category of 3 a.m. false alarms disappears without your threshold getting any less strict.

This matters more here than on a web check, because a server metric is read from a single authoritative source - your own collector - rather than confirmed across several independent checkpoints the way an availability check is. There is no second opinion to average out a momentary spike, so the debounce count is what plays that role.

What each metric warns you about

The three core metrics fail in genuinely different ways, and knowing which one you are looking at tells you how much time you have.

MetricHow the failure arrivesHow much warning you get
CPUNothing breaks. Everything gets slower - every request, every query, every background job - and the site degrades long before it falls over.Usually plenty, if you are watching. A sustained climb is visible for hours or days before it becomes user-visible.
RAMSudden and violent. Applications are killed by the operating system to reclaim memory, restart, and are killed again - producing exactly the intermittent, unreproducible outage that is hardest to diagnose.Little, at the end. But the slow climb of a memory leak between restarts is one of the most legible signals in monitoring, if the history exists.
DiskEverything at once. Logs stop writing, the database refuses writes, sessions fail, temporary files cannot be created - and the cause is invisible from the application's own error messages.The most warning of all, and the most often missed. A volume filling at a steady rate is predictable days ahead.
Connect timeA dependency the server relies on has become slow or unreachable, before that has surfaced as a full outage.Often the earliest signal you get that something downstream is wrong.

Disk deserves its reputation as the classic avoidable outage. It is the one failure that a monitor with a threshold and a week of history will always catch first, and the one that is most embarrassing to explain afterwards.

Read the trend, not just the alert

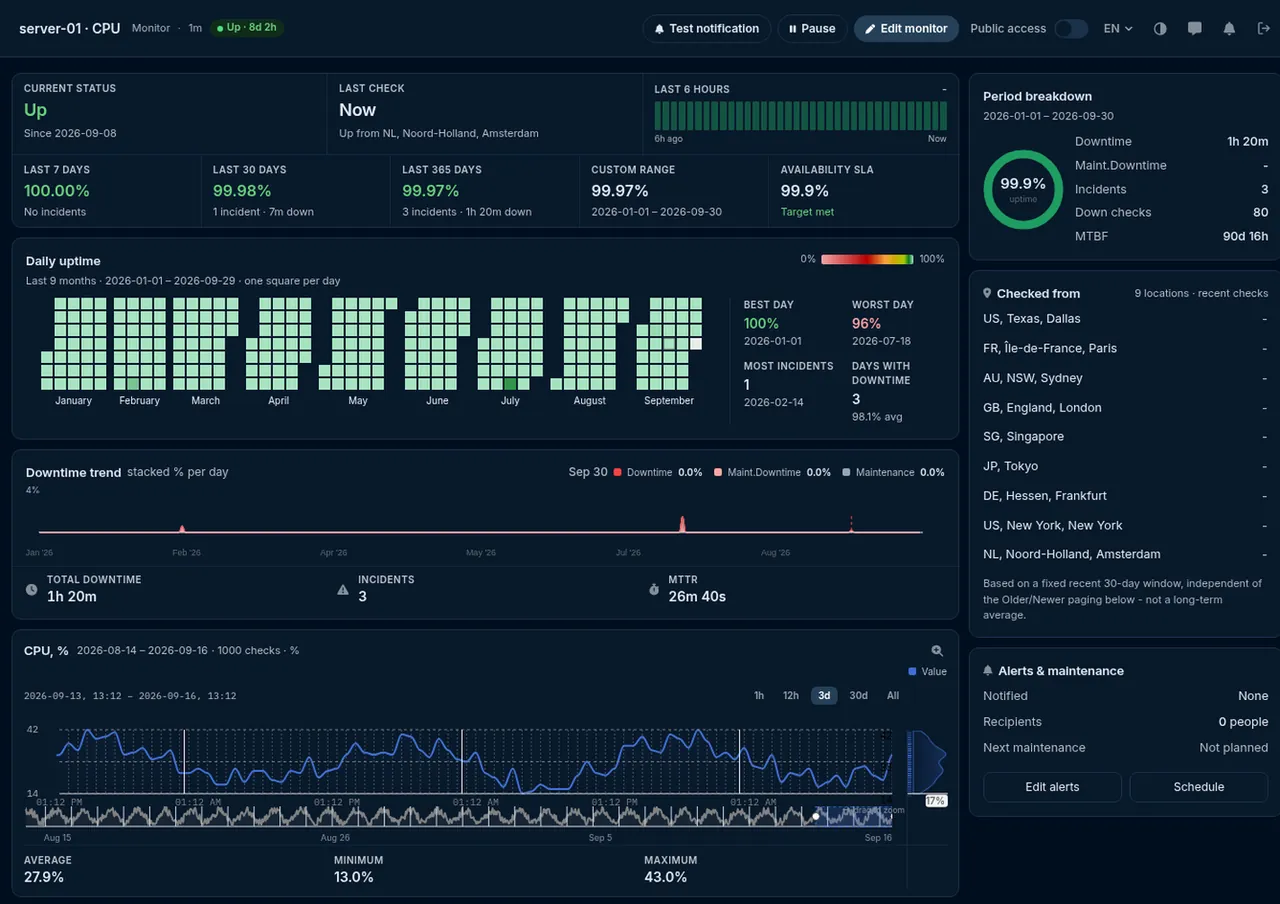
Every reading is stored, so each server monitor has a chart of its own value over time with the average, minimum and maximum for the window you are looking at. Percentages are charted as percentages and connect times in milliseconds, so a CPU monitor and a database-latency monitor each read the way you expect.

The alert tells you that something crossed a line; the chart tells you the two things you actually need next. Is this new? - a spike that looks alarming in isolation is often the same spike that has happened every Tuesday at 02:00 for a year. And where is it heading? - a memory figure that climbs steadily between restarts is a leak, whatever its current value, and a disk climbing two percent a week has a date attached to it.

That second question is the capacity-planning use of server monitoring, and it is the reason to start collecting a metric before you know what threshold to put on it. You can add the threshold in a month, once the history has told you what normal looks like. The history you did not collect is the one you cannot get back.

server-01 · disk /var · 7 days
Trending up · 2.1%/day
average73%
minimum66%
maximum81%
thresholdgreater than 90
overloads before down3
Illustrative example · your own chart shows the value your collector reports

Server monitoring and uptime monitoring answer different questions

They are complements, not alternatives, and the split is clean enough to be worth stating plainly.

Uptime monitoringServer monitoring
The question it answersCan a visitor reach the site right now?Is the machine underneath it healthy enough to keep answering?
Where it looks fromOutside - 300+ checkpoints across 158 citiesInside - a value read on the machine itself
Typical timingTells you at the moment of failureTells you before the failure, if you set the threshold below the cliff
False-alarm controlA failing observation is re-checked from other checkpoints and confirmed by a quorumA single authoritative reading, with a consecutive-overload count as the debounce
Catches a memory leakNo - until it finally crashes somethingYes - as a trend, weeks earlier
Catches a network route failure between your users and youYesNo - the machine is perfectly happy

Running only one of them leaves a real gap in each direction. The pairing most accounts settle on is a one-minute availability check from multiple locations plus a handful of server monitors on CPU, memory and the volume most likely to fill.

SNMP, for hardware that will never run a collector

Routers, switches, firewalls, UPS units and printers cannot host a script, but almost all of them already speak SNMP. A separate SNMP check reads a numeric value straight from the device by OID - interface counters, temperature, load, uptime, battery charge - over SNMP v1, v2c or v3, including v3 with authentication and privacy so credentials are not sent in the clear.

Being straight with you about where this sits today: an SNMP check reads and records the value the device reports. Threshold-based alerting on an SNMP value is not available yet - when you need a number to actually raise an incident, use a server load monitor against a collector, which has the full condition and debounce model described above.

Setting up server monitoring

  1. Decide what to expose. If your server already runs PHP or IIS, the matching ready-made collector is the fastest path; otherwise write the endpoint yourself - it returns one number.
  2. Deploy it on the server you want to watch and confirm you can request it yourself. Put it on an unguessable path. If the machine is new, the free TCP port check and the free ping test are a quick way to confirm it is reachable from the outside world before you go any further - no login required.
  3. Add a monitor of type Monitor CPU, RAM, HDD, choose which value it reads, and give it the collector's URL. For a disk monitor, name the path or drive; for a database connect-time monitor, give the connection details the collector should dial.
  4. Set the condition and limits - and set the overloads before down count deliberately rather than leaving it at the default. This is the setting that decides whether the monitor is useful or ignored.
  5. Pick an interval, anywhere from one minute to 24 hours. One minute suits a machine running something business-critical; 5 or 10 minutes is plenty for a trend like disk usage.
  6. Repeat for each value that matters on that host - CPU, memory and the volume most likely to fill is a sensible starting set - then add the contacts who should hear about it.
  7. Leave it a week before you tune anything. The first week of history is what tells you whether your threshold is right, and it is much better evidence than a guess made on day one.

Limits worth knowing

  • The collector has to be reachable. A host with no inbound access at all cannot be polled. What has to be exposed is one read-only URL, not a management port - but it does have to be exposed.
  • One monitor watches one value. CPU, memory and disk are three monitors, each with its own threshold and its own history. That is what makes the alerting precise, and it does mean a busy server uses several monitor slots.
  • Windows performance counters need the ASP.NET collector. The category / name / instance triple is read locally by that collector; a PHP host reports CPU, memory, disk and connect times instead.
  • There is no multi-location confirmation. Unlike an availability check, a server metric comes from one authoritative source, so a single anomalous reading is a real reading. The consecutive-overload count is the tool for that, and it is worth setting.
  • It reports what the collector reports. If your custom endpoint has a bug, the monitor faithfully alerts on the wrong number - which is why the optional error member in the response matters: report an error rather than a zero.
  • No network throughput counter. The available values are CPU, memory, disk usage, connect times and Windows performance counters; bandwidth is not among them. For a device that reports throughput over SNMP, an SNMP check can read and chart that counter.

Frequently Asked Questions

Server monitoring is the ongoing tracking of your server's core resource usage - CPU load, RAM (memory) usage, and HDD (disk) load - so you can see how your infrastructure is actually performing rather than just whether the website on top of it responds. HostTracker's server monitoring checks these three metrics and reports on trends and spikes over time, which matters because resource exhaustion is one of the most common root causes behind slow performance, crashes, and outright downtime. A server can be technically "up" and still be moments away from failing if CPU usage is pegged, memory is nearly exhausted, or disk space is critically low - none of which a simple availability check would necessarily reveal until the problem actually causes a visible outage.

A server can remain reachable and technically online while running dangerously close to its resource limits, which means high CPU or RAM usage is often an early warning sign of a problem rather than the problem itself. Sustained high CPU load slows down every request the server handles, degrading the experience for every visitor even though the site never fully goes down. Memory pressure is more dangerous still - as RAM usage climbs toward capacity, applications can start crashing, restarting, or being killed by the operating system to free up memory, which frequently causes the intermittent, hard-to-diagnose outages that look like random glitches rather than a clear failure. Catching elevated CPU or RAM usage through server monitoring, before it escalates into a crash, gives administrators time to investigate and add capacity proactively.

When CPU, RAM, or disk load monitoring detects unusual activity - a sustained spike, memory climbing toward capacity, or disk space running low - HostTracker sends a notification through whichever of its 9 alert channels you've configured, including email, SMS, voice call, webhooks, Slack, and messenger apps like Telegram, Discord and Viber. This means the person responsible for server infrastructure finds out about a developing resource problem directly, rather than discovering it only after it has already caused a slowdown or crash that customers notice. Because reports and alerts are generated automatically from the monitored data, administrators get a documented history of resource trends alongside the real-time notification, which helps distinguish a one-off spike from a genuine capacity problem needing a longer-term fix.

Uptime monitoring answers a narrower question: is the website or service reachable and responding right now. Server monitoring looks underneath that surface at the infrastructure actually running the site - CPU load, memory usage, and disk space - which are frequently the root cause behind an uptime failure rather than a separate, unrelated concern. A server running low on memory or disk space can still pass an uptime check for a while before it finally crashes or slows to a crawl, so relying on uptime monitoring alone means you find out about the problem only after it has already become an outage. Combining both gives a fuller picture: uptime monitoring confirms the site is currently reachable, while server monitoring tracks the underlying resource trends that predict whether it's likely to stay that way.

Check frequency is configurable to match how quickly you need to know about a developing resource issue. HostTracker's paid plans support monitoring intervals as fast as once a minute, which is useful for servers running business-critical applications where a resource spike needs to be caught and addressed quickly. Less critical or lower-traffic servers can use a longer interval, and the permanent free plan checks two monitors every 30 minutes, which is often enough to catch a sustained trend like disk space steadily filling up over days, even if it wouldn't catch a very short-lived CPU spike. A 30-day full-feature trial with no credit card required lets you try faster check intervals and see how much detail the resulting data gives you before choosing a plan.

No - there is no HostTracker agent to install, no daemon to keep running and no credentials to hand over. A server load check works the other way round: your server exposes one small read-only endpoint that reports a single number, and HostTracker requests it on the schedule you set. You have three ways to provide it. Two are ready-made collector scripts you drop onto a server you already run - one for PHP on Linux or Unix, one for ASP.NET on IIS - and the third is to write the endpoint yourself, which takes about ten lines in any language: read the value however you like and answer with a small JSON object containing it. That third option is the one many teams prefer, because it means nothing they did not write themselves ever runs on their machine, and they decide exactly which numbers are exposed. Nothing is ever pushed to your server automatically, and HostTracker never opens a management session on it.

The collector endpoint has to be reachable by HostTracker's checkers, so a server behind a firewall with no inbound access at all cannot be polled directly. In practice this is a smaller obstacle than it sounds, because what has to be exposed is a single read-only URL that returns one number - not SSH, not a management port, not a monitoring protocol. The usual approaches are to publish the endpoint on an unguessable path, to restrict it to the addresses that call it, or to host it on a machine in the same network that is already internet-facing and have it report on the private host's behalf. Whatever you choose, the exposure is deliberately tiny: the endpoint accepts no commands, changes nothing, and returns a single number. That is a very different security conversation from installing a third-party agent with system-level access, which is exactly why the check is designed this way.

Server load monitoring - CPU, RAM, and HDD checks - is one of the 13 check types available across HostTracker's product, and the permanent free plan lets you monitor two servers or sites at no cost, with checks every 30 minutes. HostTracker as a whole isn't a free-only product - it's a paid monitoring service with a free tier alongside it - so the free plan works well for trying server monitoring on a couple of machines or as a lightweight option for smaller projects, not as the primary offering. For monitoring more servers, shorter check intervals, or business-critical infrastructure where faster detection matters, paid plans start at around $5 a month, and a 30-day full-feature trial with no credit card required lets you test the faster intervals before deciding.

30-day free trial - no credit card

Catch server overload before it takes you down

Start a free trial and get alerted when CPU, RAM, or disk load crosses your thresholds.