Database monitoring

Database monitoring: connection and query checks for SQL Server, MySQL and PostgreSQL

HostTracker's database monitoring connects to your SQL Server, MySQL or PostgreSQL database on a schedule, runs the query you define and checks that the result is what it should be, so a silent database problem is caught before it becomes an outage.

  • Trusted since 2004
  • 500,000+ websites monitored
  • 300+ checkpoints worldwide

How one database check runs, from the connection to the alert

Connect, query, verifyEvery check opens a connection, runs the query you wrote and checks what came back.
Timed at every stepDNS, connection and query time are kept per check, so a slowdown is visible before it is an outage.
Through a dedicated agentDatabase checks run from HostTracker's own agents, not the public checkpoints - reach and credentials, not geography.

One query, one expectation

Write the query as you would in a console; say what its result must be.

db.example.com · PostgreSQL · pass

SELECT count(*) FROM orders
WHERE created_at > now() - '1 hour'

-- rule
value gt 0

The query is yours

A SELECT that proves the database is doing its job - a count, a latest timestamp, a health row.

The result is checked, not just received

Equal, greater than, in a range, not null: the returned value has to satisfy the rule, every check.

Connection failures are their own alert

A refused or timed-out connection is reported as such, separately from a query that answers slowly or wrong.

How it reaches your database

What the check needs

Reach, credentials and a query - nothing installed on the database host.

A host and a port the agent can reachThe check connects like any client would; allow HostTracker's agent addresses in your firewall.
A read-only accountCredentials with the least rights the query needs. They are used for the check and nothing else.
The query and the ruleWhat to run and what the answer must be. A malformed query is refused when you save.
An interval and a contact ladderHow often to run it, and who is told first, then later, if the result keeps failing.
Database Monitoring

Database health check: know before your database becomes an outage

Every check connects to your database, runs a query, and verifies the response - so slow queries and connection problems are caught before they cascade into a wider outage.

Connection

Connection & Query Checks

Host Tracker monitors your databases to make sure they work well and are available when you need them. It checks the status and responsiveness of your databases, helping to prevent issues that could affect your business. It supports many database types, including MySQL, PostgreSQL, and Microsoft SQL Server.

Performance

Performance Tracking

Host Tracker monitors databases and keeps them healthy. The service checks connection stability, query execution speed and overall performance. This helps administrators find and fix problems before they get worse. Host Tracker also provides reports and alerts, which help you respond quickly and avoid downtime.

Alerts

Catch Problems Early

Host Tracker offers several advantages for database monitoring. It keeps databases available, so businesses can operate smoothly and customers are happy. The platform's alerts and reports help you find and fix problems quickly. Host Tracker is also a great tool for businesses that want to improve their database management.

What a database monitor records

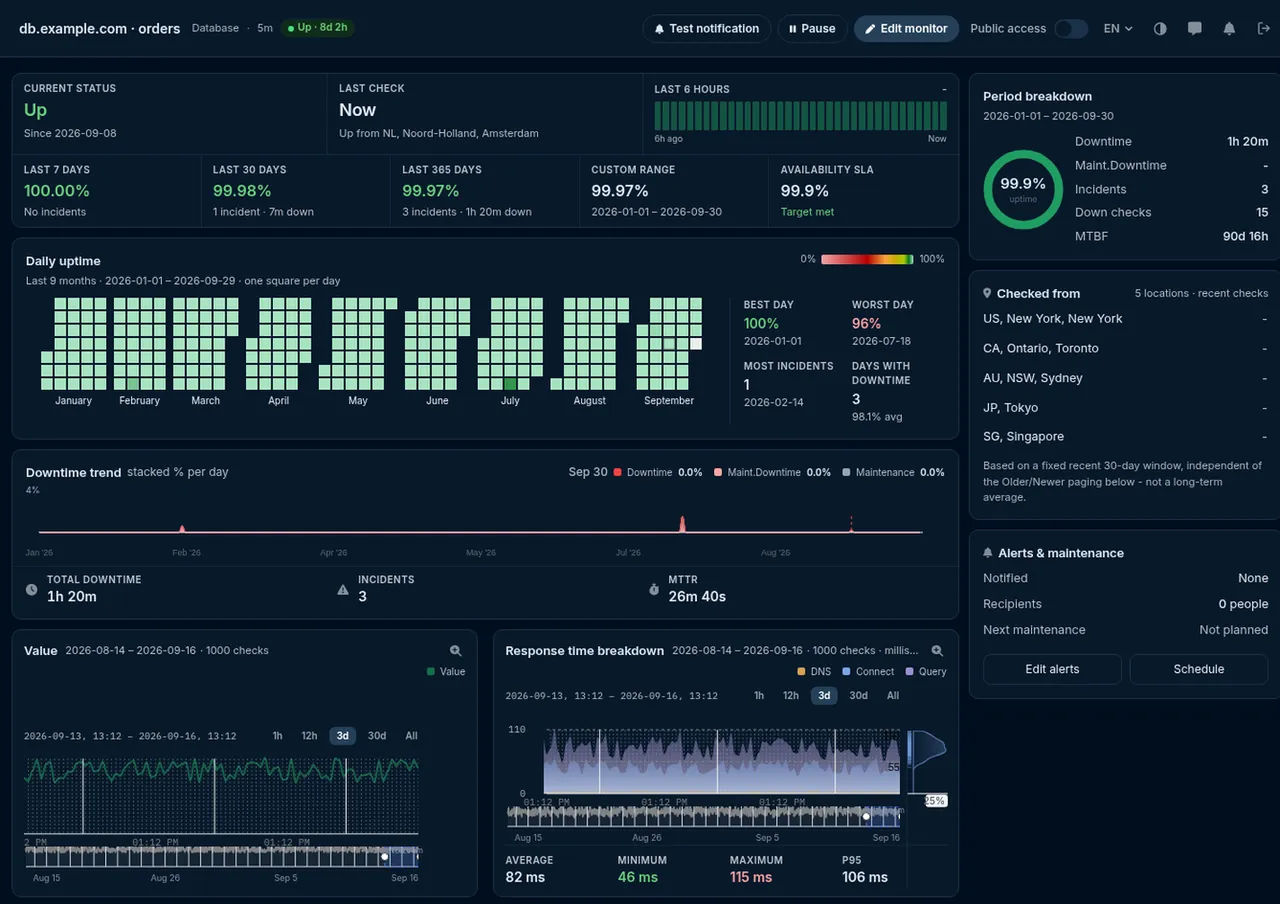
Connection and query time per check, and the value the query returned.

Response time, layer by layer

DNS, connection and query time stacked per check - a slow handshake and a slow query look different.

The returned value, charted

The number your query returns is drawn per check, so a queue that stops draining is visible before the rule trips.

HostTracker database monitor statistics: connection and query time per check and the returned value

Every layer of your stack, monitored

Websites, servers, APIs, certificates. One check type per page, the same locations, alerts and reports behind all of them.

Trusted by teams at

Microsoft Panasonic OTP Bank OneProvider Worldmate
The full guide

Database monitoring, explained

Every chapter opens in place, so the page stays short.

Key takeaways

Key takeaways

  • A database monitor connects to SQL Server, Oracle, MySQL, PostgreSQL or Firebird, optionally runs a query you supply, and measures how long the connection and the query take.
  • The value the query returns is compared against a threshold you set - equal, not equal, greater, less, inside an interval or outside one - so a row count or a queue depth can fail the check as well as an outage can.
  • These checks run from HostTracker's own internal check network rather than the public location fleet, so there is no location to choose; the credentials are stored server-side and are never returned by the API.
  • Alerts arrive by email, SMS, voice call, Slack, Microsoft Teams, PagerDuty, Telegram, Discord or a signed webhook.
  • Database monitoring is included from the $14 per month Webmaster plan upward, and in the 30-day trial, which covers 100 monitors with no credit card.

Frequently Asked Questions

Database connection and query monitoring is an automated check that regularly connects to your database and verifies both that the connection succeeds and that queries run against it return correct, timely results. It matters because a database can fail in ways that don't show up as a simple "down" state - connections can succeed while queries run slowly, a specific query can start returning unexpected results after a schema change, or the database can be technically reachable while genuinely overloaded. HostTracker's database monitoring checks connection stability and query execution as part of the same check, which gives a more complete picture of database health than availability monitoring on the application layer alone. Since most websites and applications depend entirely on their database, a database problem often becomes a wider outage if it isn't caught and addressed at the source.

HostTracker's database monitoring supports a variety of database providers, including MySQL, PostgreSQL, and Microsoft SQL Server, among others, so most common backend setups can be covered by the same monitoring approach rather than needing a separate tool per database type. This matters for teams running mixed environments - for example, a primary application database on one engine and a reporting or legacy database on another - since a single monitoring setup can watch connection stability and query results across different database systems rather than fragmenting visibility across multiple tools. Whatever the specific database engine, the underlying goal is the same: confirm the database is reachable, responsive, and returning the data your application expects, so a database-layer problem is caught before it surfaces as a broader application outage.

A connection check only confirms that the database is reachable and accepting new connections - a useful baseline, but one that says nothing about whether the data inside is correct or whether queries are performing acceptably. Checking query results goes further by actually running a query and validating its output or response time, which can catch problems a connection check would miss entirely: a query that's grown slow due to a missing index, a table returning unexpected or stale data after a bad migration, or a specific feature-critical query failing while the database as a whole remains reachable. HostTracker's database monitoring checks both connection stability and query execution together, since a database that accepts connections but serves slow or incorrect query results is still a real problem for the application relying on it, even though a connection-only check would report it as healthy.

A database can accept new connections successfully while still suffering from problems that a simple reachability check can't see - a specific query running dramatically slower than normal due to missing indexes or a growing table, a lock contention issue causing certain operations to hang, disk space filling up on the database server, or a recent schema change silently breaking a query the application depends on. Because the connection itself succeeds in all these cases, only a check that actually executes a query and evaluates the result or its response time can catch this category of problem. This is exactly why database monitoring goes beyond a basic "is the server up" check: application-level slowness or incorrect behavior frequently traces back to a database issue that stays invisible to connection-only monitoring until it degrades badly enough to cause a visible outage.

Database problems are one of the most common root causes behind application outages, since most websites and services depend entirely on their database being available and performant. By checking connection stability and query execution on a regular schedule, database monitoring surfaces early warning signs - slowing queries, intermittent connection failures, unexpected query results - before they escalate into a full outage that affects every user of the application at once. HostTracker's database monitoring sends alerts through your configured notification channels as soon as a problem is detected, giving administrators time to investigate and fix an emerging issue, such as adding an index or freeing up disk space, before it causes a wider service disruption. Catching database problems at the source, rather than after they cascade into an application-wide outage, is what makes this kind of monitoring valuable.

Check frequency for database monitoring is configurable, similar to HostTracker's other check types: paid plans support intervals as fast as once a minute for databases supporting business-critical applications where a developing problem needs to be caught quickly, while the permanent free plan checks two monitors every 30 minutes, which works for lower-priority or internal databases where a short detection delay isn't especially costly. Choosing the right interval depends on how much a database problem would actually cost you - a production database behind a live application generally benefits from more frequent checks than a reporting database used only occasionally. A 30-day full-feature trial with no credit card required lets you test faster check intervals and see how quickly issues get detected before deciding what frequency your database needs.

30-day free trial - no credit card

Catch database problems before they become outages

Start a free trial and monitor connection health and query results across MySQL, PostgreSQL and SQL Server.

30-day free trial - 100 monitors - no credit card
  • Trusted since 2004
  • 500,000+ websites monitored
  • 300+ checkpoints worldwide

Part of HostTracker's website monitoring software.