Guide how to configurate Page Speed
Published: 2024-11-04 all articlesGuide how to configurate Page Speed
PageSpeed - website performance test from selected location of the globe using browsers. It checks for problems each element of the page and measures time, required for its download or execution.
-
Navigate to the site monitoring configuration page.
-
Select “Page speed” as the monitoring type.
-
Enter the URL/Domain/IP of the website you want to monitor in the provided field.
-
Optionally, assign a task name for easy identification.
-
Set an interval for how often the check should be performed (e.g., every 3 minutes).
-
Adjust the timeout setting according to your preference. If a response is not received within this time, an alert will be triggered.
-
Add tags if needed for categorization and faster search within your monitored sites group.
-
Enable or disable options like full log, open stats, and web users monitoring according to your requirements:
-
Full log: Allows saving every check result without grouping them.
-
Open stats: Share statistics and logs with other people, including unregistered users.
-

Page Stats:
Certainly! Here are instructions for setting up page speed monitoring:
-
Page Load Timeout:
-
This is the overall timeout for page load, including requests made after the window.load event (e.g., ajax requests).
-
-
Document/IFrame Loading Fail Threshold:
-
The number of errors when loading resources of type Document/IFrame. When this threshold is reached, it indicates failure.
-
-
CPU Usage Threshold:
-
The browser’s CPU usage percentage (per core). If it exceeds the threshold, it’s considered a failure.
-
-
Memory Usage Threshold:
-
The browser’s memory usage in megabytes (Mb). If it exceeds the threshold, it’s considered a failure.
-
-
Client-Side Errors Threshold:
-
The number of errors logged to the console. When this threshold is reached, it indicates failure.
-
-
Client-Side Warnings Threshold:
-
The number of warnings logged to the console. When this threshold is reached, it indicates failure.
-
Content:
-
Page Load Timeout Without XHR:
-
The timeout for page load before the window.load event (occurs when resources and their dependencies finish loading).
-
Unlike the regular page load timeout, this time does not include requests generated by page scripts.
-
-
Total Load Fails Threshold:
-
The total number of errors when loading any resources on the page. When this threshold is reached, it indicates failure.
-
-
Script Load Fails Threshold:
-
The number of errors when loading resources of type Script. When this threshold is reached, it indicates failure.
-
-
Stylesheet Load Fails Threshold:
-
The number of errors when loading resources of type Stylesheet. When this threshold is reached, it indicates failure.
-
-
Image Load Fails Threshold:
-
The number of errors when loading resources of type Image. When this threshold is reached, it indicates failure.
-
-
Font Load Fails Threshold:
-
The number of errors when loading resources of type Font. When this threshold is reached, it indicates failure.
-
-
AJAX Request Fails Threshold:
-
The number of errors when executing AJAX requests (XHR). When this threshold is reached, it indicates failure.
-
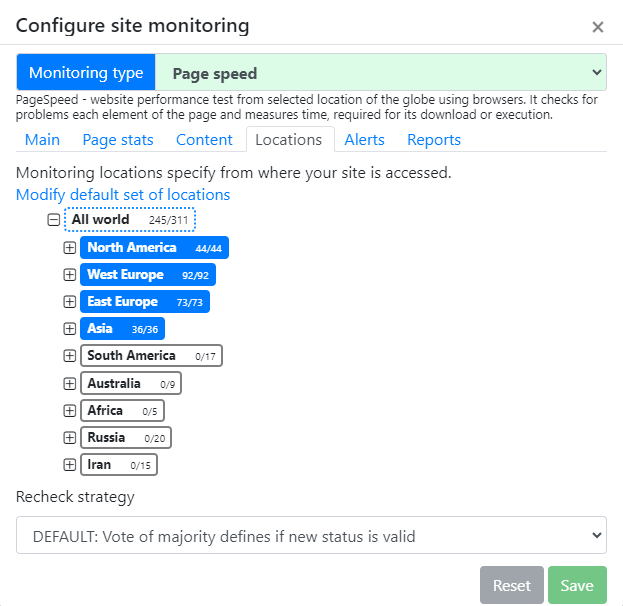
Under the “Locations” tab, choose specific regions or “All world” to monitor from various geographical locations.
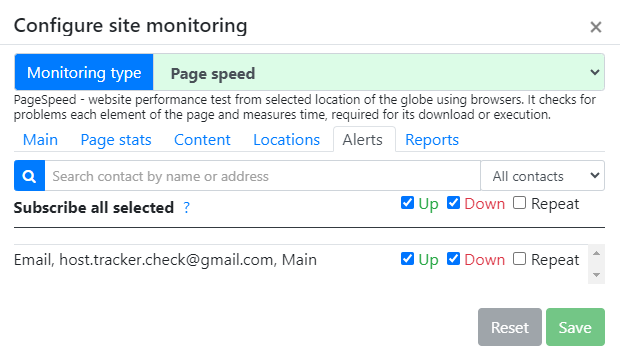
Choose Your Notification Preferences:
-
In the “Subscribe all selected” section, you’ll find three options:
-
“Up”: Select this if you want to receive notifications via email one month, 7 days, and 3 days before your domain expiration date.
-
“Down”: Choose this option to get notified when your domain name has already expired.
-
“Repeat”: Opt for this if you wish to receive daily alerts until the issue is resolved.
-
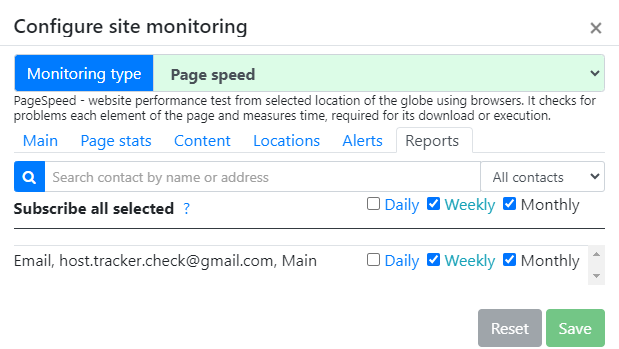
Uptime Reports:
-
Under “Subscribe all selected,” choose the frequency of uptime reports: daily, weekly, or monthly.
-
Enter an email address where these reports will be sent.
-
Click “Save” to apply your settings.