
Jak nastavit monitoring rychlosti stránky
Monitoring rychlosti stránky načte vaši stránku ve skutečném prohlížeči, ze skutečné lokality monitorování, a sleduje, jak se toto jedno načtení stránky chová: které zdroje selžou, kolik CPU a paměti prohlížeč spálí, a zda se stránka dokončí před timeoutem, který zvolíte. HTTP kontrola vám řekne, že server odpověděl; monitoring rychlosti stránky vám řekne, zda se stránka, kterou vykreslí prohlížeč návštěvníka, sestavila čistě. Pokud potřebujete naskriptovat vícekrokovou cestu (přihlásit se, přidat do košíku, odeslat formulář) místo sledování jednoho načtení stránky, podívejte se místo toho na návod na kontrolu transakcí - obě řídí skutečný prohlížeč, ale kontrola transakcí sleduje sled akcí napříč relací.
Hlavní nastavení
Pro tento typ neexistuje vyhrazený snímek obrazovky pro skupinu Hlavní nastavení, ale každý ovládací prvek v ní je standardní napříč typy monitorů HostTracker:
- Doména/IP - URL nebo doména, která se má načíst. Přijímá plnou URL nebo holou doménu.
- Název - volitelný popisek zobrazený ve vašem dashboardu, upozorněních, zprávách a widgetech. Pokud je prázdný, použije se URL.
- Rozvrh intervalu / rozvrh cron - segmentovaný přepínač mezi jednoduchým opakujícím se intervalem a plným výrazem cron (hodinové, denní, týdenní, měsíční přednastavení, nebo pokročilá syntaxe cron). Minimální dostupný interval závisí na vašem plánu.
- Značky - volný text pro seskupování a filtrování tohoto monitoru.
- Úplný protokol - uloží každý jednotlivý výsledek kontroly pro tento monitor bez seskupování.
- Veřejné statistiky - umožní sdílet statistiky a protokoly tohoto monitoru s dalšími lidmi, včetně těch, kteří nejsou přihlášení.
Tato skupina také nese přepínač Povoleno, který monitor pozastaví nebo obnoví.
Konfigurace stránky
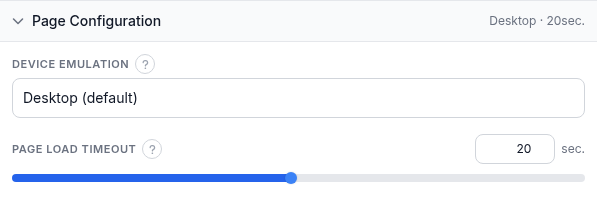
- Emulace zařízení - rozbalovací seznam, který načte stránku tak, jak by ji viděl konkrétní typ zařízení: velikost viewportu, řetězec user agent a emulace dotykového vstupu. Výchozí je Desktop. Seznam dostupných zařízení se stahuje živě z vlastní sady schopností flotily agentů, takže se přesné možnosti mohou časem rozrůstat; zvolte zařízení, které nejlépe odpovídá tomu, jak vaši návštěvníci stránku prohlížejí.
- Timeout načítání stránky - maximální čas povolený pro dokončení načítání stránky, od 1 do 40 sekund. Pokud stránka do té doby nedokončí načítání, kontrola selže.
Obě nastavení mění, co čísla znamenají, i to, zda kontrola uspěje. Viewport velikosti telefonu může vyvolat jinou sadu obrázků, rozvržení a skriptů než desktopový viewport téže stránky, takže časování běhu s mobilní emulací není přímo srovnatelné s desktopovým během - berte každé nastavení zařízení jako vlastní výchozí hodnotu. Timeout načítání stránky je strop, ne cíl: definuje jen bod, kde to kontrola vzdá a nahlásí selhání. Nastavení příliš blízko běžné době načítání vaší stránky promění obyčejný rozptyl na falešné poplachy; nastavte ho s rezervou a místo toho sledujte skutečnou dobu načítání ve výsledcích.
Ověření odpovědi
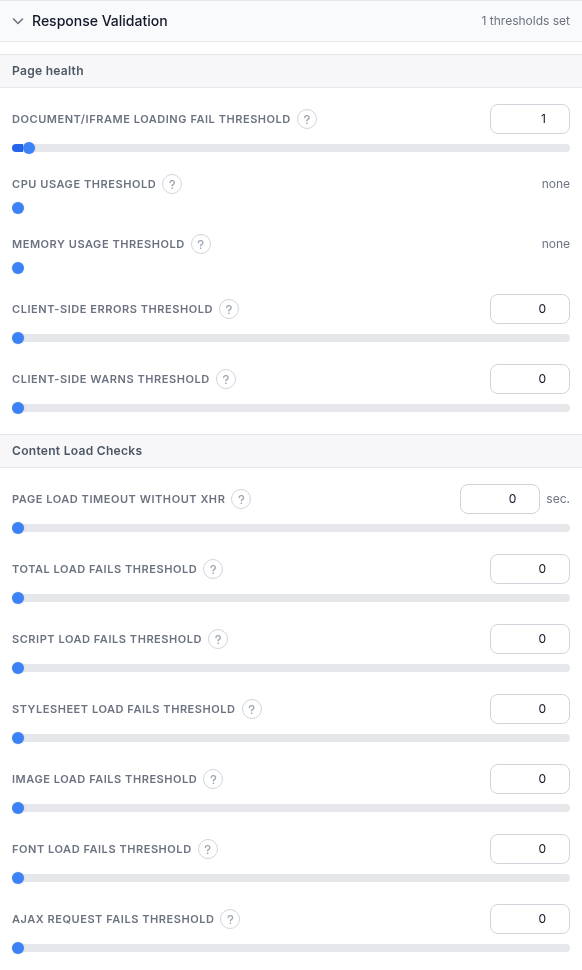
Toto není skóre Core Web Vitals - HostTracker zde nepočítá hodnocení výkonu ve stylu Lighthouse. Místo toho počítá konkrétní selhání na úrovni prohlížeče a limity využití zdrojů, a vy rozhodujete, která z nich se mají počítat jako Down. Každý práh níže lze nastavit na 0 (nebo u CPU a paměti přepnout na "bez prahu"), čímž ho vypnete.
Zdraví stránky:
- Práh selhání načítání dokumentu/iframe - kontrola přejde na Down, když na stránce selže načtení alespoň tolika dokumentů nebo iframe. Rozsah 0-50; 0 ho vypne.
- Práh využití CPU - kontrola přejde na Down, když využití CPU stránky (na jádro) dosáhne tohoto procenta. Posuvník pokrývá jen 80-100 %, takže zachytí těžké špičky CPU, ne běžnou zátěž; samostatný ovládací prvek "bez prahu" ho úplně vypne, což je výchozí stav.
- Práh využití paměti - kontrola přejde na Down, když využití paměti stránky dosáhne tohoto množství, v megabajtech. Rozsah 1-1000 MB v krocích po 50 MB, nebo "bez prahu" pro vypnutí, což je výchozí stav.
- Práh chyb na straně klienta - kontrola přejde na Down, když se při načítání stránky objeví alespoň tolik chyb v konzoli prohlížeče. Rozsah 0-50; 0 ho vypne.
- Práh varování na straně klienta - stejná myšlenka pro varování v konzoli. Rozsah 0-50; 0 ho vypne.
Kontroly načítání obsahu:
- Timeout načítání stránky bez XHR - alternativní, kratší timeout, který platí, jakmile se ustálí všechny požadavky XHR/AJAX na pozadí stránky, oddělený od hlavního timeoutu načítání stránky výše. Při hodnotě 0 (výchozí) platí jen hlavní timeout načítání stránky; nenulová hodnota vám umožní přijmout stránku, jejíž viditelný obsah je hotový, i když dotazování na pozadí ještě pokračuje.
- Práh celkových selhání načítání - kontrola přejde na Down, když se nepodaří načíst alespoň tolik zdrojů, jakéhokoli druhu. Rozsah 0-50; 0 ho vypne.
- Práh selhání skriptu / stylu / obrázku / fontu / požadavku AJAX - stejné počítání selhání, rozdělené podle typu zdroje, takže můžete tolerovat nespolehlivý reklamní obrázek, aniž byste tolerovali rozbitý skript. Každý je 0-50, 0 ho vypne.
Umístění monitorování
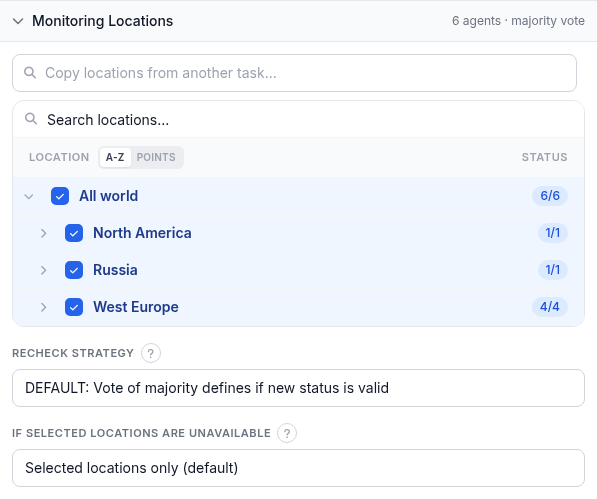
- Lokality - prohledávatelný strom zaškrtávacích políček regionů a jednotlivých kontrolních bodů. Zvolte konkrétní lokality, nebo ponechte zaškrtnuté "All world".
- Strategie opětovné kontroly - co se stane, když kontrola zjistí změnu stavu. Výchozí volba zopakuje kontrolu z několika lokalit a přijme nový stav hlasováním většinou, aby ochránila před falešným poplachem z jedné nespolehlivé lokality. Alternativy: stanovený počet lokalit musí potvrdit Down (odkryje posuvník potvrzení Down od 1 do 7); vůbec žádná opětovná kontrola; plná shoda každé lokality opětovné kontroly; nebo plná shoda pro Down, zatímco Up potřebuje jen většinu.
- Pokud jsou vybrané lokality nedostupné - "Pouze vybrané lokality" (výchozí) čeká, až se vrátí vámi zvolené lokality; "Nejbližší lokality" nahradí nejbližšími dostupnými; "Libovolná lokalita" spadne zpátky na celý svět.
Odběry upozornění
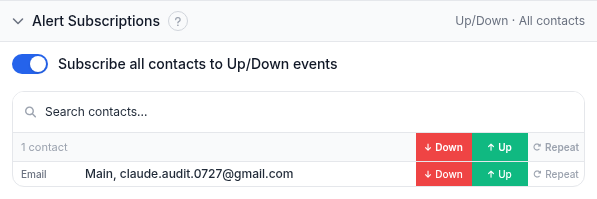
Přepínač přihlásí každý kontakt k událostem Up/Down jedním krokem, nebo vám prohledávatelná tabulka umožní přihlásit jednotlivé kontakty k Down, Up a Repeat (připomínky opakovaného Down) nezávisle. Ponechání této sekce prázdné znamená, že se pro tento monitor neodešle žádné upozornění - panel vás na to výslovně upozorní.
Předplatné zpráv
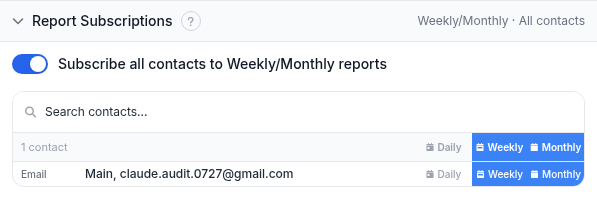
Stejný vzor platí pro zprávy o dostupnosti: přepínač přihlásí každý kontakt k týdenním a měsíčním zprávám, nebo můžete zvolit Denně, Týdně a Měsíčně pro každý kontakt zvlášť.
Vypracovaný příklad
Řekněme, že chcete sledovat, jak si stránka pokladny vede u mobilních zákazníků. Zvolili byste Rychlost stránky, zadali URL stránky pokladny a nastavili Emulaci zařízení na profil telefonu místo Desktop, protože většina provozu na této stránce je mobilní. Timeout načítání stránky ponechte pohodlně nad běžnou dobou načítání stránky - je to strop určený k zachycení skutečných selhání, ne cíl výkonu. V Ověření odpovědi nastavte Práh selhání načítání dokumentu/iframe na 1, protože stránka běžně načítá platební iframe a chcete vědět, jestli se přestane načítat. Prahy využití CPU a paměti ponechte na "bez prahu", protože stránka pokladny je jen zřídka náročná na CPU nebo paměť a tyto prahy stejně začínají až na 80 %. Práh celkových selhání načítání nastavte na 2 nebo 3 místo 0, aby jeden nespolehlivý sledovací skript třetí strany nevolal váš tým pokaždé, když se zasekne, zatímco skutečně rozbité načtení kontrolu pořád spustí. Timeout načítání stránky bez XHR ponechte na 0, protože stránky pokladny často dotazují stav platby na pozadí a to by nemělo rozhodovat o úspěchu nebo selhání. Spusťte kontrolu ze dvou nebo tří lokalit blízko vašich skutečných zákazníků, ponechte výchozí strategii opětovné kontroly hlasováním většinou, přihlaste svůj kontakt pohotovostní služby k upozorněním Down a Repeat a nastavte týdenní zprávu na sdílenou adresu týmu.
Řešení potíží
- Kontrola hlásí Down, ale stránka vám při vlastním otevření připadá v pořádku. Nejspíš spustil čítač selhání načítání (skript, obrázek, celkem atd.) kvůli nespolehlivému zdroji třetí strany, například reklamní síti nebo analytickému skriptu, ne kvůli vaší vlastní stránce. Než usoudíte, že jde o skutečný výpadek, zkontrolujte, který čítač se spustil, a zvažte jeho zvýšení z 0 na 1 nebo 2, pokud je tato nespolehlivost známý, tolerovatelný vzorec.
- Doby načítání se výrazně změnily po přepnutí Emulace zařízení. Očekávané, ne regrese: jiný profil zařízení mění viewport, user agent a emulaci dotyku, což mění, co se na stránce načte a jak se vykreslí. Porovnávejte časování jen v rámci stejného nastavení zařízení.
- Kontrola stále naráží na Timeout načítání stránky, i když se stránka ve vašem vlastním prohlížeči načítá v pořádku. Lokalita monitorování může být daleko od vašeho serveru, nebo timeout měří celé načtení včetně pomalých požadavků na pozadí. Zvyšte timeout se skutečnou rezervou, a pokud stránka po dokončení viditelného obsahu pokračuje v dotazování na pozadí, zkuste nenulový Timeout načítání stránky bez XHR.
- Prahy využití CPU nebo paměti se zdají nikdy nespustit, ani na náročné stránce. Oba začínají na "bez prahu" a posuvník CPU po zapnutí pokrývá jen 80-100 %. Pokud na sledování vysokého využití zdrojů záleží, výslovně přepněte ovládací prvek z "bez prahu" a zvolte hodnotu v rozsahu.
- Varování konzole z reklamních nebo analytických skriptů stále spouštějí Práh varování na straně klienta. Mnoho skriptů třetích stran zaznamenává varování, která nejsou skutečné problémy. Ponechte tento práh na 0, nebo ho nastavte nad běžný počet varování vaší stránky.
Související
- Monitoring časování přístupu v prohlížeči - stránka produktu pro tento typ kontroly.
- Bezplatný test rychlosti stránky - spusťte jednorázovou kontrolu, než nastavíte průběžný monitoring.
- Návod na kontrolu transakcí - pro naskriptování vícekrokové cesty uživatele místo sledování jednoho načtení stránky.
- Pravidla ověření odpovědi - jazyk pravidel používaný pro ověřování kontrol HTTP a API.
- Jak zkontrolovat rychlost webu - jednorázový test a co znamená každé číslo časování.
- Všechny návody k monitoringu - návod na nastavení pro každý další typ kontroly.