
Руководство по настройке мониторинга базы данных
Проверка Database по расписанию подключается к серверу базы данных, подтверждает, что соединение установилось, и опционально может выполнить запрос и оценить его результат. Используйте ее, когда проверки на основе URL недостаточно, потому что то, за чем нужно следить, находится за приложением, а не перед ним: заполняющийся пул соединений, плановая задача, из-за которой таблица перестала обновляться, или запрос, раньше возвращавший одну строку, а теперь - ни одной.
Прежде чем начать
Проверки Database не идут из распределенной публичной сети мониторинга HostTracker так, как это делает проверка Http или Ping, поэтому у этой формы вообще нет раздела «Локации мониторинга». Вместо этого каждая проверка обращается к вашему серверу с собственной приватной инфраструктуры проверки HostTracker, используя два фиксированных исходных адреса: 4.207.101.172 и 20.107.152.200 (Северная Европа). Прежде чем сохранить монитор, добавьте оба адреса в список разрешенных файрвола или группы безопасности сервера базы данных и убедитесь, что сервер принимает соединения на своем порту из публичного интернета, либо хотя бы с этих двух адресов. Если порт недоступен, каждая проверка проваливается с ошибкой соединения независимо от того, как настроен остальной монитор.
Настройте сам мониторинговый аккаунт прежде, чем начинать: создайте пользователя базы данных специально для проверки, выдайте ему только то, что нужно проверке (обычно это просто право подключиться, плюс SELECT на таблицу, к которой обращается ваш запрос), и избегайте переиспользования аккаунта приложения или администратора. Если запрос, который вы планируете выполнять, изменяет данные, дайте этому аккаунту право записи только на конкретную задействованную таблицу, не шире.
Целевая база данных
Три поля определяют, к чему подключается проверка, и стоят над сворачиваемыми разделами, поскольку они обязательны:
- Тип сервера - выпадающий список поддерживаемых провайдеров: Microsoft SQL Server, Oracle, MySQL, PostgreSQL и Firebird.
- Сервер : Порт - имя хоста или IP сервера базы данных и его порт. При смене типа сервера автоматически подставляется стандартный порт этого провайдера по умолчанию (1433 для SQL Server, 1521 для Oracle, 3306 для MySQL, 5432 для PostgreSQL, 3050 для Firebird) - переопределять его нужно только если ваш сервер слушает на другом порту.
- База данных (или, для Oracle, вместо этого Service и Instance name (SID)) - имя базы данных для подключения. Для Oracle можно указать имя сервиса, SID, или оба значения, в зависимости от того, как настроен ваш listener.
Ниже необязательное поле Имя позволяет подписать монитор для оповещений, отчетов и виджетов - полезно, когда у вас больше одной проверки базы данных и их нужно быстро различать.
Основные настройки
Эта группа содержит расписание и два общих переключателя, которые есть у любого типа проверки:
- Интервал - как часто выполняется проверка, доступны значения от 10 минут до 24 часов (10, 15, 30, 45 минут, затем 1, 2, 4, 6, 12 и 24 часа), плюс альтернатива в виде cron-расписания для менее регулярного графика. Проверки Database не предлагают интервалы короче 10 минут, доступные у некоторых других типов проверок.
- Теги - произвольные метки для группировки и фильтрации мониторов в других местах панели управления.
- Полный лог - сохраняет каждый отдельный результат проверки вместо только сгруппированных сводок, полезно, когда нужно видеть точное время отклика или значения во времени, а не только историю работает/не работает.
- Открытая статистика - делает страницу статистики и лога этого монитора доступной для просмотра, в том числе людьми без входа в аккаунт.
Подключение
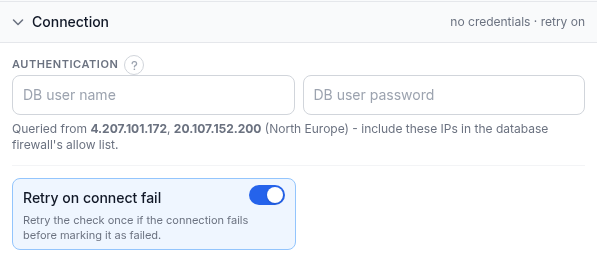
Поскольку цель уже задана выше, этот раздел описывает, как проверка аутентифицируется и как она обрабатывает неудачную попытку подключения:
- DB user name и DB user password - учетные данные мониторингового аккаунта, описанного выше. Оба поля необязательны: оставьте их пустыми, если ваша база данных допускает доверенное или анонимное подключение с адреса из списка разрешенных, что бывает в некоторых внутренних настройках.
- Сама панель показывает два исходных адреса, с которых выполняются проверки (
4.207.101.172,20.107.152.200), с напоминанием добавить их в список разрешенных файрвола вашей базы данных - это то же требование, что описано в разделе «Прежде чем начать», повторенное здесь, потому что именно тут находятся учетные данные. - Retry on connect fail - переключатель, включенный по умолчанию, который повторяет попытку подключения один раз, прежде чем пометить проверку как проваленную. Он касается только самого шага подключения, а не запроса.
Проверка ответа
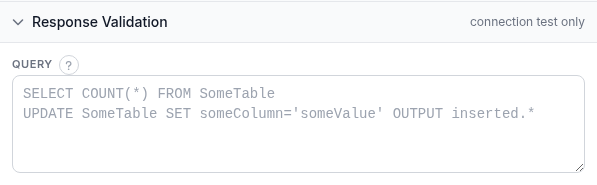
Это ключевое решение в проверке Database: тестируете ли вы просто работоспособность соединения или то, что конкретный запрос по-прежнему ведет себя как ожидается.
- Query - оставьте это поле пустым, и проверка будет тестировать только соединение: оно открывается и закрывается, и это вся проверка целиком. Впишите любой SQL, который разрешено выполнять вашему мониторинговому аккаунту, -
SELECTили изменяющую данные инструкцию вродеUPDATE,DELETEилиINSERT, - и проверка будет выполнять его при каждом опросе и сможет оценивать результат. - Query result (показывается только после ввода запроса) - выберите Scalar value, чтобы прочитать значение из первого столбца первой возвращенной строки (естественный выбор для
SELECT, либо дляUPDATE/INSERTс предложениемOUTPUT), либо Row count, чтобы прочитать, сколько строк было затронуто (естественный выбор для обычногоUPDATE,DELETEилиINSERTбез собственного набора результатов). - Result verification - сравнение, применяемое к этому значению: No verification (запрос просто должен выполниться без ошибки), Equal to, Not equal to, Greater than, Less than, In range или Out of range. Варианты больше/меньше и диапазон добавляют одно или два числовых поля с переключателем включения/исключения на каждой границе диапазона.
- Retry query on error - переключатель, включенный по умолчанию, который повторяет выполнение запроса один раз при неудаче, отдельно от повтора на уровне соединения выше.
Выбирайте вариант «только соединение», когда нужно просто знать, что база данных доступна и принимает соединения - это ловит явные сбои. Выбирайте запрос с проверкой результата, когда одной доступности недостаточно, чтобы поймать настоящую проблему: таблицу, переставшую получать новые строки, сохраненный счетчик, уходящий за пределы нормального диапазона, или конкретные данные, которые всегда должны присутствовать.
Подписки на оповещения
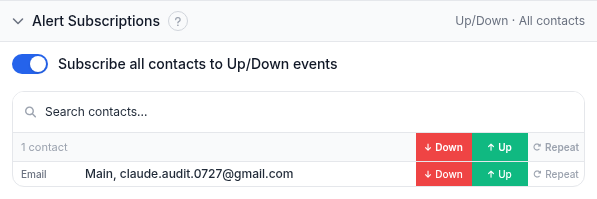
Выберите, какие контакты узнают об этом мониторе и по каким событиям - Up, Down и Repeat (повторное напоминание, пока проверка остается в Down). Один переключатель подписывает всех контактов сразу на Up/Down, либо выберите отдельные контакты и события в таблице под ним.
Подписки на отчеты
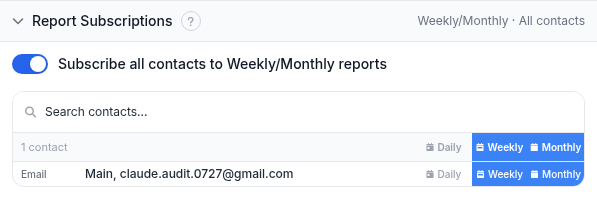
Отдельно от оповещений выберите, кто получает периодические отчеты об аптайме и производительности по этому монитору - ежедневные, еженедельные или ежемесячные - по email.
Разобранный пример
Наблюдение за продакшен-базой PostgreSQL, от которой зависит приложение: тип сервера PostgreSQL, Сервер : Порт db.example.com:5432, база данных myapp_prod. В разделе Connection указан выделенный аккаунт только для чтения, а оба исходных IP предварительно добавлены в группу безопасности базы данных. В поле Query указано SELECT COUNT(*) FROM orders WHERE created_at > now() - interval '1 hour', Query result - Scalar value, а Result verification - Greater than с лимитом 0: если за последний час не было записано ни одного заказа, значит что-то вышестоящее перестало писать, и проверка уходит в Down, даже несмотря на то что база данных доступна. Интервал - 15 минут, оба переключателя Retry остаются включенными, чтобы кратковременный сбой не поднимал ложное оповещение, оповещения идут всей команде по подписке Up/Down, а еженедельный отчет уходит владельцу аккаунта.
Диагностика
- Каждая проверка проваливается с ошибкой соединения. Самая частая причина - файрвол, не открытый для двух исходных адресов HostTracker: убедитесь, что
4.207.101.172и20.107.152.200в списке разрешенных, и что сам порт открыт для них. - Соединение устанавливается, но аутентификация проваливается. Проверьте, что имя пользователя и пароль БД верны и что у аккаунта есть право подключаться именно к указанной базе данных, а не только к серверу.
- Запрос, прекрасно работающий в клиентском инструменте, здесь ничего не возвращает. У обычного
UPDATE,DELETEилиINSERTбез предложенияOUTPUTнет набора результатов, который можно прочитать как Scalar value - переключите Query result на Row count, либо добавьте предложениеOUTPUT, если вам нужны данные строки обратно. - Result verification никогда не срабатывает. Убедитесь, что сравнение и числовые поля соответствуют ожидаемому диапазону: граница, установленная как «исключена», а не «включена», - простой способ сделать так, чтобы лимит никогда не сработал.
- Редкие единичные сбои, которые вы подозреваете кратковременными. Оба переключателя повтора включены по умолчанию и уже повторяют попытку один раз, прежде чем провалить проверку - если сбои все равно частые, проблема, скорее всего, реальная, связанная с соединением или запросом, а не шум.
Связанные материалы
- Мониторинг запросов к базе данных - страница продукта для этого типа проверки.
- Руководство по мониторингу CPU, RAM и диска - еще одна проверка, работающая с приватной инфраструктуры HostTracker, а не с публичной сети, полезная вместе с проверкой базы данных на том же сервере.
- Руководство по мониторингу SNMP - для чтения значений напрямую с сетевого оборудования вместо базы данных.
- Режим ассертов и правила проверки ответа - язык правил проверки ответа, используемый и в других типах проверок HostTracker.
- Все возможности мониторинга HostTracker - посмотрите все типы проверок рядом друг с другом.
- 503 Service Unavailable - статус, который сайт возвращает, когда база данных за ним перестает отвечать.
- Все руководства по мониторингу - руководство по настройке для каждого другого типа проверки.