
Návod na nastavení monitoringu CPU, RAM a disku
Kontrola čítače (v panelu Nový monitor označená jako Monitor CPU, RAM, HDD) čte podle rozvrhu jednu číselnou hodnotu a umí upozornit, když tato hodnota překročí práh, který nastavíte. Hodnotou může být zátěž CPU, využití paměti, využití disku, doba připojení portu, doba připojení databáze, nebo čítač výkonu Windows. Odpovídá na jinou otázku než kontrola dostupnosti: ne "odpovídá web", ale "nedochází stroji pod ním místo".
Než začnete
Pro tento typ kontroly neexistuje instalovatelný agent HostTracker, ani výběr umístění monitorování pro jednotlivý monitor. Dotazování běží z vlastní privátní kontrolní infrastruktury HostTracker, ne z distribuované veřejné sítě. Kontrola funguje naopak: váš server vystaví jeden malý koncový bod, který odpoví jediným číslem, a HostTracker se ho ptá podle rozvrhu. Existují tři způsoby, jak takový koncový bod poskytnout, volené nastavením Poskytovatel hodnot níže, a ať zvolíte kterýkoli, musí být nasazený a dostupný ještě před vytvořením monitoru:
- Napište si koncový bod sami (možnost vlastní). Odpoví malým objektem JSON, což je možnost, kterou mnoho týmů preferuje, protože na jejich serveru nikdy neběží nic, co si sami nenapsali.
- Nasaďte hotový kolektor PHP od HostTracker na webový server Linux/Unix.
- Nasaďte hotový handler ASP.NET 4.0 od HostTracker na server IIS/Windows.
Hostitele bez jakéhokoli příchozího přístupu nelze dotazovat. Co musí být vystavené, je jedna URL jen pro čtení, která vrací číslo, ne administrativní port, ale vystavená pro kontrolory HostTracker být musí.
Zdroj monitorování
Pro tuto sekci není k dispozici snímek obrazovky, ale každý ovládací prvek v ní pořád stojí za vysvětlení, protože je to to, co odlišuje tento typ kontroly od zbytku panelu.
- Poskytovatel hodnot - rozbalovací seznam se třemi možnostmi. Poskytovatel hodnot - vaše vlastní webová služba (vlastní): váš koncový bod odpoví
{"v": 12.34, "e": "error text", "vs": "version string"}, a musí být přítomna alespoň hodnota nebo řetězec chyby, takže koncový bod vracející jen{"v": 42.5}hlásí při každé kontrole 42,5. Kolektor HostTracker - PHP, pro webové servery *nix: potřebuje zapnutýshell_execvphp.ini(spouští příkazytop,freeadf), plus rozšířenímysql/mysqlipro čtení doby připojení MySQL. Kolektor HostTracker - ASP.NET 4.0, pro IIS/Windows: identita fondu aplikací potřebuje práva na čtení čítačů výkonu a registru, obvykle stačí Network Service. Oba hotové kolektory se stahují z této sekce a musí se nasadit na cílový server ručně; HostTracker na váš server nikdy nic netlačí automaticky. - Pole URL monitoru hned pod tím má u vlastní možnosti popisek Úplná adresa URL monitorování (přesná adresa koncového bodu, vytočená tak, jak je) nebo Základní adresa URL monitorování pro hotový kolektor (kořen webu, pod který byl skript kolektoru nasazen; HostTracker k němu připojí vlastní název souboru kolektoru).
- Jakmile zvolíte hotový kolektor, objeví se rozbalovací seznam Typ čítače: Využití CPU %, Využití RAM %, Využití disku nebo souborového systému %, Doba připojení portu (ms), Doba připojení MySQL (ms), a jen u ASP.NET, Doba připojení SQL Server (ms) a Čítač výkonu Windows. Každý přináší vlastní pole: písmeno disku nebo cestu *nix, hostitele a port, připojovací řetězec (s odkazem na vzorový formát), nebo trojici kategorie/název/instance pro čítač výkonu (instance může zůstat prázdná pro výchozí, často
_Total).
Hlavní nastavení
Hlavní nastavení pro tento typ nemá vyhrazený snímek obrazovky, takže zde je každý ovládací prvek v něm:
- Interval - od 1 minuty do 24 hodin, plus alternativa v podobě rozvrhu cron. Jedna minuta se hodí pro byznys-kritický stroj; 5 nebo 10 minut plně stačí pro pomalejší trend, jako je využití disku.
- Značky - volné štítky pro seskupování a filtrování monitorů.
- Úplný protokol - uloží každou jednotlivou dotázanou hodnotu místo jen seskupených souhrnů.
- Veřejné statistiky - zpřístupní stránku statistik a protokolu tohoto monitoru ke sdílení, včetně s lidmi, kteří nejsou přihlášení.
- Opakovat při selhání připojení - přepínač, ve výchozím stavu zapnutý, který jednou zopakuje pokus, než selhání získání hodnoty označí jako vyloženou chybu.
- Ovládací prvky Poskytovatel hodnot, URL monitoru a Typ čítače popsané výše v části Zdroj monitorování žijí v panelu také v této skupině.
Ověření odpovědi
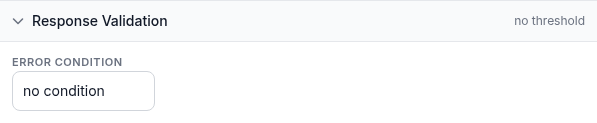
Zde proměníte surové čtení v upozornění, a zde čtenáři obvykle narážejí na potíže. Příliš přísný práh se spustí při každé běžné špičce, a příliš volný se nespustí, dokud už na tom nezáleží.
- Chybová podmínka - na snímku ukázaná ve výchozí hodnotě bez podmínky, což znamená, že monitor jen hlásí hodnotu bez verdiktu Down. Volba rovná se, nerovná se, menší než nebo větší než odkryje jedno číselné pole pro limit; volba v rozsahu nebo mimo rozsah odkryje dvě, dolní a horní limit.
- Přetížení před Down - objeví se, jakmile zvolíte jinou podmínku než "bez podmínky". Je to posuvník od 0 do 20: počet po sobě jdoucích kontrol, které už musí porušovat podmínku, než se monitor přepne na Down. Při 0 se okamžitě počítá už jediné porušující čtení; při 3, například, jsou potřeba tři kontroly za sebou nad limitem. HostTracker toto vyhodnocuje centrálně, ne stroj, který je sledovaný, a rozhoduje o tom, zda je monitor užitečný, nebo jen neustále křičí vlka. Server, jehož zátěž CPU vyskočí na pár sekund několikrát za hodinu, potřebuje debounce nad 0, jinak se každá běžná špička promění v upozornění.
Volba samotného prahu je úsudek specifický pro to, co sledujete. Neexistuje jedno správné číslo, takže mu věnujte skutečnou pozornost místo ponechání výchozí hodnoty. Jedna užitečná vlastnost této kontroly: selhání získání hodnoty (kolektor je nedosažitelný, vyprší časový limit, nebo vrátí něco neparsovatelného) se hlásí jako chyba okamžitě a nikdy se nepočítá do debounce výše, takže nespolehlivé spojení s kolektorem nemůže naplnit počet po sobě jdoucích přetížení určený pro skutečný tlak na zdroje.
Odběry upozornění
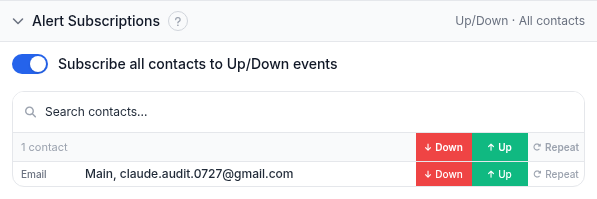
Zvolte, které kontakty se o tomto monitoru dozví a pro které události: Up, Down, a Repeat (opakovaná připomínka, dokud kontrola zůstává dole). Jeden přepínač přihlásí každý kontakt k Up/Down naráz, nebo v tabulce pod ním zvolte jednotlivé kontakty a události.
Odběry zpráv
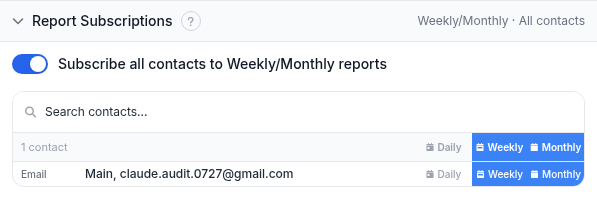
Nezávisle na upozorněních zvolte, kdo dostává pravidelné zprávy pro tento monitor - denně, týdně nebo měsíčně - e-mailem.
Vypracovaný příklad
Sledování místa na disku na serveru Linux, který už provozuje PHP: rozbalte hotový kolektor PHP na server a potvrďte, že je dosažitelný na vlastní URL. Nastavte Poskytovatel hodnot na možnost kolektoru PHP, URL monitoru na základní adresu webu, Typ čítače na Využití disku nebo souborového systému %, a cestu souborového systému na /dev/sda1. Nastavte Chybovou podmínku na větší než, s limitem 90 (procent), a Přetížení před Down na 3, takže jsou potřeba tři po sobě jdoucí čtení nad 90 %, než se spustí upozornění. Krátká špička ze zálohovací úlohy ho nespustí, ale trvalé zaplňování ano. Interval je 10 minut, a CPU a RAM dostanou vlastní samostatné monitory na stejném serveru se stejným kolektorem.
Řešení potíží
- Kolektor je nedosažitelný. Hostitele bez jakéhokoli příchozího přístupu nelze dotazovat. Potvrďte, že koncový bod odpovídá zvenčí vaší vlastní sítě, na neodhadnutelné cestě, pokud se obáváte vystavení, protože nepřijímá žádné příkazy a nic nemění.
- Monitor upozorňuje na zjevně špatné číslo. Kontrola hlásí, cokoli kolektor hlásí. Opravte koncový bod a zvažte, aby místo špatného čísla hlásil volitelný řetězec chyby, když se na jeho straně něco pokazí.
- Upozornění se spouští při každé drobné špičce. Zvyšte Přetížení před Down místo samotného prahu. Ponechání na 0 způsobí, že se počítá jediná špička.
- Kolektor PHP hlásí "shell_exec is denied on server." Čtení CPU, RAM a disku všechna spouštějí systémové příkazy, takže potvrďte, že
shell_execnení v seznamu zakázaných funkcí vphp.ini. - Kontrola čítače výkonu Windows hlásí chybu. Identita fondu aplikací potřebuje práva na čtení čítačů výkonu a registru; pokud ještě není Network Service, zkuste ji na to nastavit.
Související
- Všechny návody k monitoringu - centrum pro každý typ kontroly HostTracker.
- Co je monitoring serveru - k čemu tato čtení slouží a jak zapadají vedle kontrol dostupnosti.
- Monitoring serveru: CPU, RAM a disk - stránka produktu pro tento typ kontroly.
- Návod na monitoring SNMP - alternativní cesta ke stejným metrikám na hardwaru, který nedokáže provozovat kolektor, například routery a přepínače.
- Monitoring databázových dotazů - pro sledování dotazů a výsledků databáze přímo, nad rámec čísla doby připojení.
- Návod na kontrolu databáze - další kontrola, která běží z privátní infrastruktury HostTracker.
- Bezplatný nástroj na kontrolu portu - rychlý způsob, jak potvrdit, že je port dosažitelný, než kolem něj zapojíte plný monitor doby připojení.
- Režim pravidel a pravidla ověření odpovědi - jazyk pravidel ověření odpovědi používaný jinde v HostTracker.